| The Layer Sensitivity option allows you to estimate the design sensitivity to layer thickness variations. OptiLayer provides two possibilities: layer sensitivity with respect to design target and with respect to the theoretical design performance.
You can specify relative errors in layer thicknesses on Layers Sensitivity Setup window (Fig. 1). If the relative errors in layer thicknesses \(\delta_H, \delta_L\), then the disturbed designs have thicknesses \(d_1,d_2,…, d_i(1+\delta_{H,L}),…,d_m. \) For each disturbed design, the variations \(\Delta MF_i\) with respect to design target \[ \Delta MF_i=|MF(d_1,…,d_i(1+\delta_{H,L}),…,d_m)-MF(d_1,…,d_m)|\] or to theoretical spectral characteristic \(S\) (Eq.(2)): \[ \Delta MF_i=|S(d_1,…,d_i(1+\delta_{H,L}),…,d_m)-S(d_1,…,d_m)|.\] |
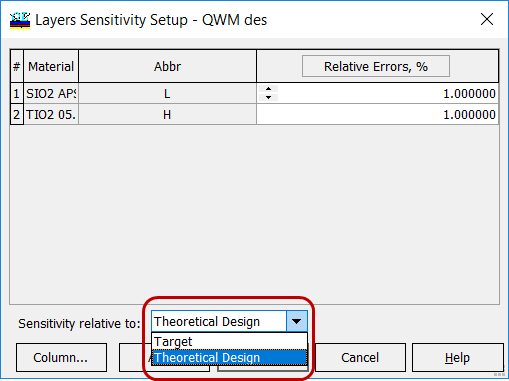
Fig. 1. Layer sensitivity settings in the case of a quasi-quarter-wave narrow band pass filter: errors of 1% in high- and low-index materials are specified. |
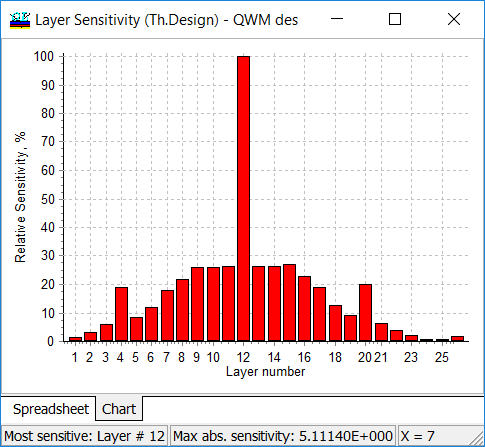
| Then, layer sensitivities \(LS(i)\) are calculated and ranged from 0 to 100% (Fig. 2, column Relative sensitivity). The corresponding ranges are displayed. The layer ranked number 1 in the Sensitivity order is the layer that is most sensitive to change, it is assigned a relative sensitivity of 100%.
\[ LS(i)=\frac{\Delta MF_i}{\max_{i=1,…,m}\Delta MF_i}\cdot 100\%\] In the Layer Sensitivity spreadsheet, absolute layer sensitivities are shown. In the Layer Sensitivity Chart tab, relative layer sensitivities are plotted. |
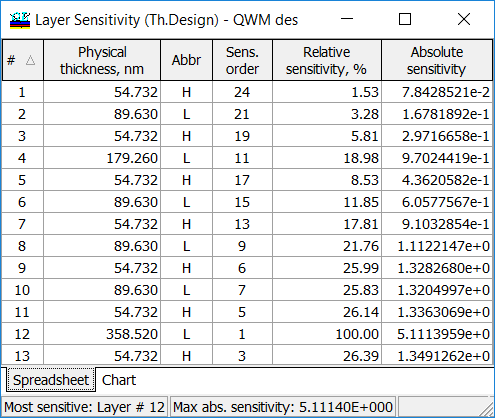
Fig. 2. Layer sensitivity spreadsheet. |
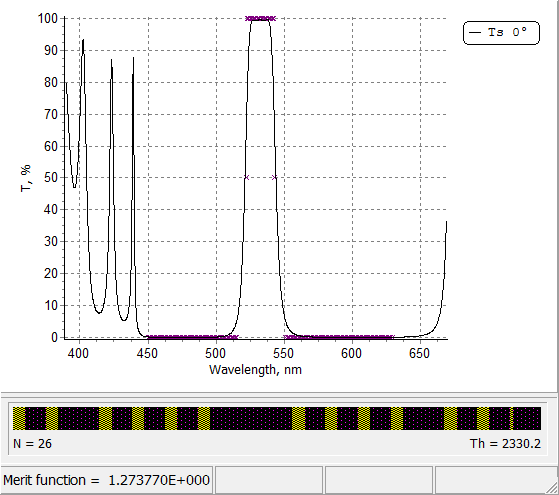
Fig. 3.Theoretical transmittance of a narrow band-pass filter. Crosses represent the design target. The design is obtained using the WDM option. Layer sensitivities with respect to design target and theoretical design performance are shown in Figs 4 and 5, respectively. Layer sensitivities are actively used in Sensitivity Directed Refinement algorithm, the powerful design tool of OptiLayer. Examples are here. |
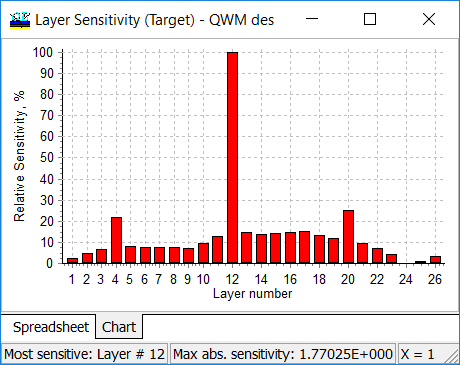
Fig 4. Layer sensitivity calculated with respect to design target.
Fig. 5. Layer sensitivity calculated with respect to the theoretical design performance. |
| Layer sensitivity can be estimated for stacks as well (starting from 9.96 version).
Stack is a set of thick media separated by gaps. Each surface can be coated by a multilayer. In Figs. 6-8, an example of stack is presented. The stack consists of two substrates, BK7 and B270, separated by an air gap, the surfaces are coated with AR_1, AR2, AR3, and AR4 12-layer coatings. Layer materials are TiO2, SiO2, and Nb2O5. |
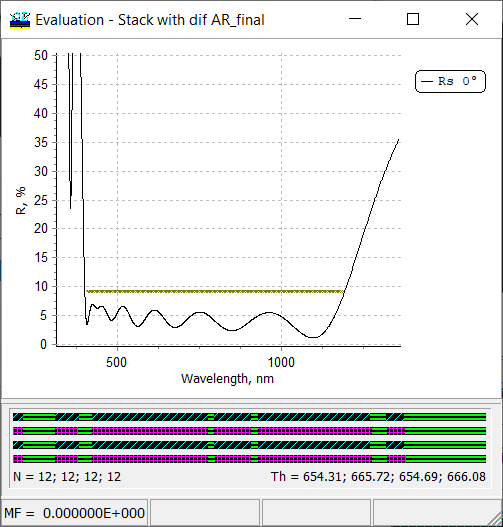
Fig. 6. Spectral reflectance of a stack shown in Figs. 7 and 8. |
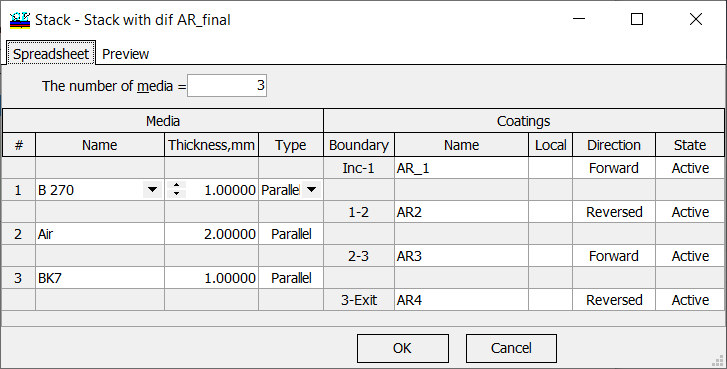
Fig. 7. Specification of the stack. |
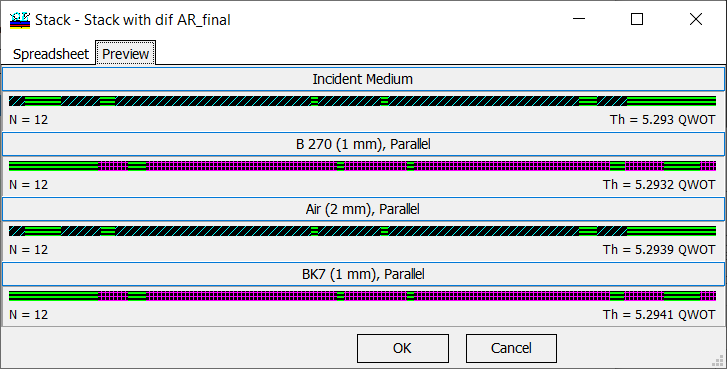
Fig. 8. Preview of the stack. |
| Sensitivities of layers in different coatings are shown by different colors (Fig. 9). The sensitivities were calculated assuming 0.5%, 1%, and 2%, in SiO2, Nb2O5, and TiO2 thin-film material. | 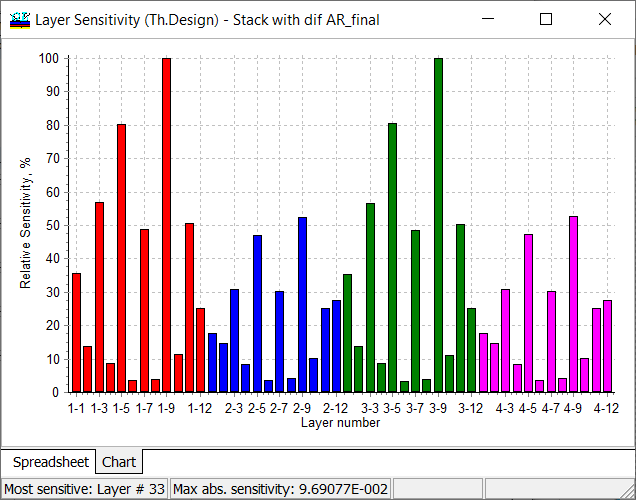
Fig. 9. Layer sensitivities: sensitivities of layers in different coatings are shown by different colors. |
OptiLayer provides user-friendly interface and a variety of examples allowing even a beginner to effectively start to design and characterize optical coatings. Read more…
Comprehensive manual in PDF format and e-mail support help you at each step of your work with OptiLayer.
If you are already an experienced user, OptiLayer gives your almost unlimited opportunities in solving all problems arising in design-production chain. Visit our publications page.
Look our video examples at YouTube
OptiLayer videos are available here:
Overview of Design/Analysis options of OptiLayer and overview of Characterization/Reverse Engineering options.
The videos were presented at the joint Agilent/OptiLayer webinar.