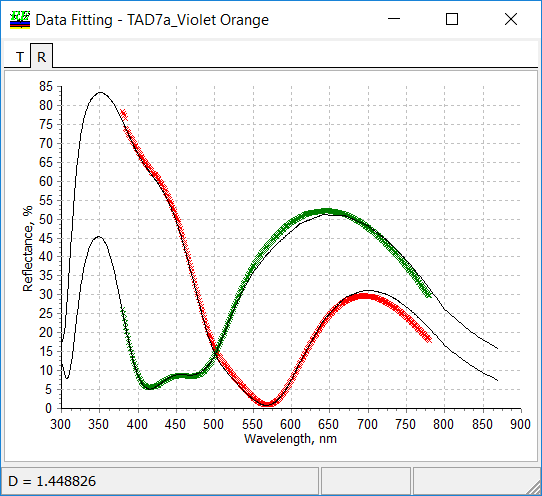
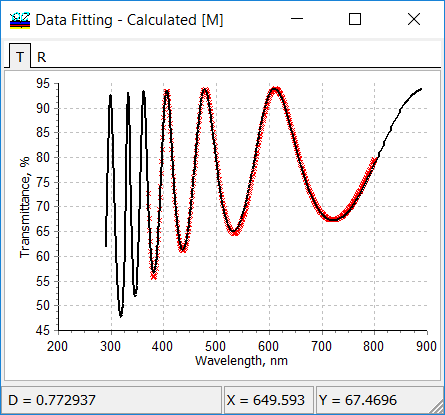
| In the Data Fitting Window, OptiRE/OptiChar compare the measurement data and corresponding model spectral characteristics:
|
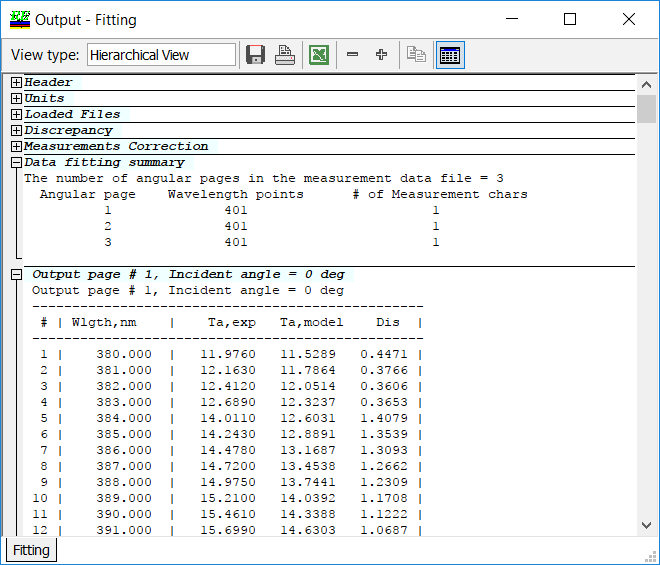
OptiRE/OptiChar allow previewing the text with the information about the fitting of measurement data by theoretical spectral characteristics. This text can be saved or exported to Excel by one mouse click:
|
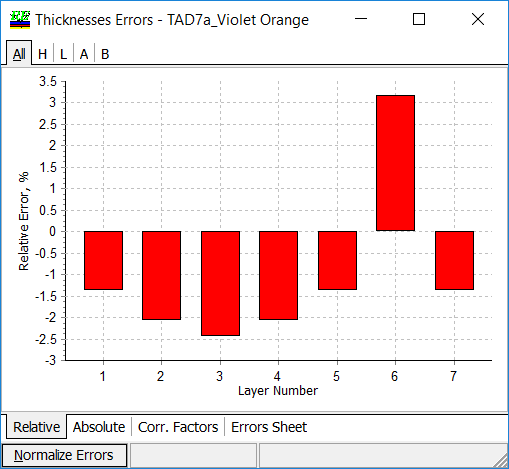
| OptiRE present thickness errors determined in the course of post-production characterization as a diagram or as different tables of values:
|
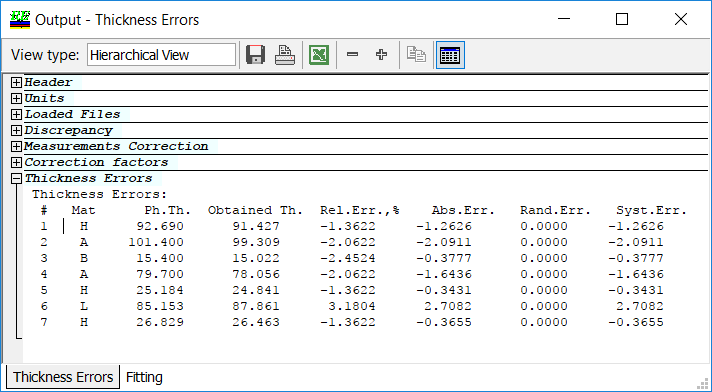
OptiRE presents the current systematic and random errors in layer thicknesses in the text form (Thickness Errors Report):
|
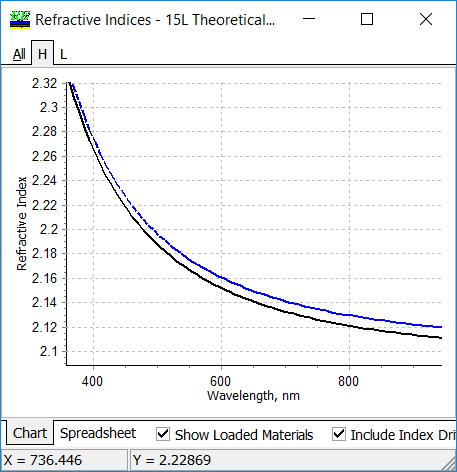
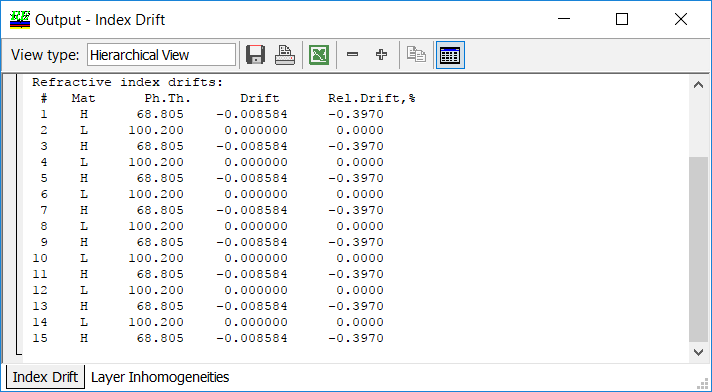
| OptiRE plots initial, corrected refractive indices, drifted refractive indices or/and Layer Inhomogeneities if Refractive Index Correction option was applied or/and Index Drifts (Offsets) and Layer Inhomogeneities were determined in the course of the post-production characterization:
|
The corresponding reports: Refractive indices Report, Index Drift Report and Inhomgeneities Report allow previewing the numerical values in the text form:
|
| OptiChar plots fitting of the experimental data by model data:
|
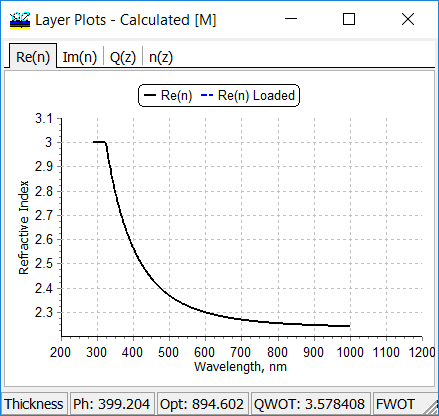
Determined refractive indices, extinction coefficients, thickness dependence of the refractive index are shown in corresponding windows:
|
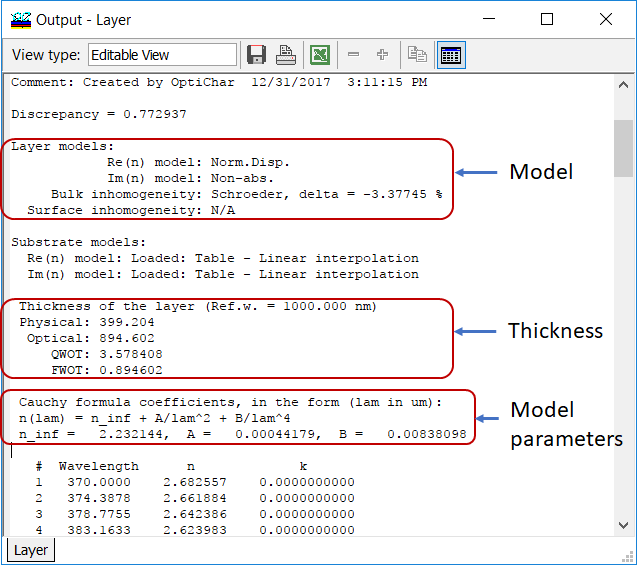 |
OptiChar collects and show all layer information obtained in the course of the layer characterization in the Layer Report:
A similar report (Substrate Report) can be created if you characterized a substrate.
|
OptiLayer provides user-friendly interface and a variety of examples allowing even a beginner to effectively start to design and characterize optical coatings. Read more…
Comprehensive manual in PDF format and e-mail support help you at each step of your work with OptiLayer.
If you are already an experienced user, OptiLayer gives your almost unlimited opportunities in solving all problems arising in design-production chain. Visit our publications page.
Look our video examples at YouTube
OptiLayer videos are available here:
Overview of Design/Analysis options of OptiLayer and overview of Characterization/Reverse Engineering options.
The videos were presented at the joint Agilent/OptiLayer webinar.

