Monochromatic Monitoring Spreadsheet

Monochromatic optical monitoring remains a powerful tool in optical coating production. Level monitoring specification of a monitoring wavelength(s) and a termination level of monitoring signal for each coating layer. The termination level of the monitoring signal (transmittance or reflectance) determines the instant (trigger point) at which layer deposition should be terminated. A sequence of monitoring wavelengths and corresponding termination levels forms a monitoring spreadsheet. This spreadsheet may also include other useful information, for example, signal amplitude, maxima and minima values of the monitoring signal during layer deposition. OptiLayer has a powerful tool for creating of monitoring spreadsheets. The tool is available through:

Results –> Monitor

Monitoring spreadsheet

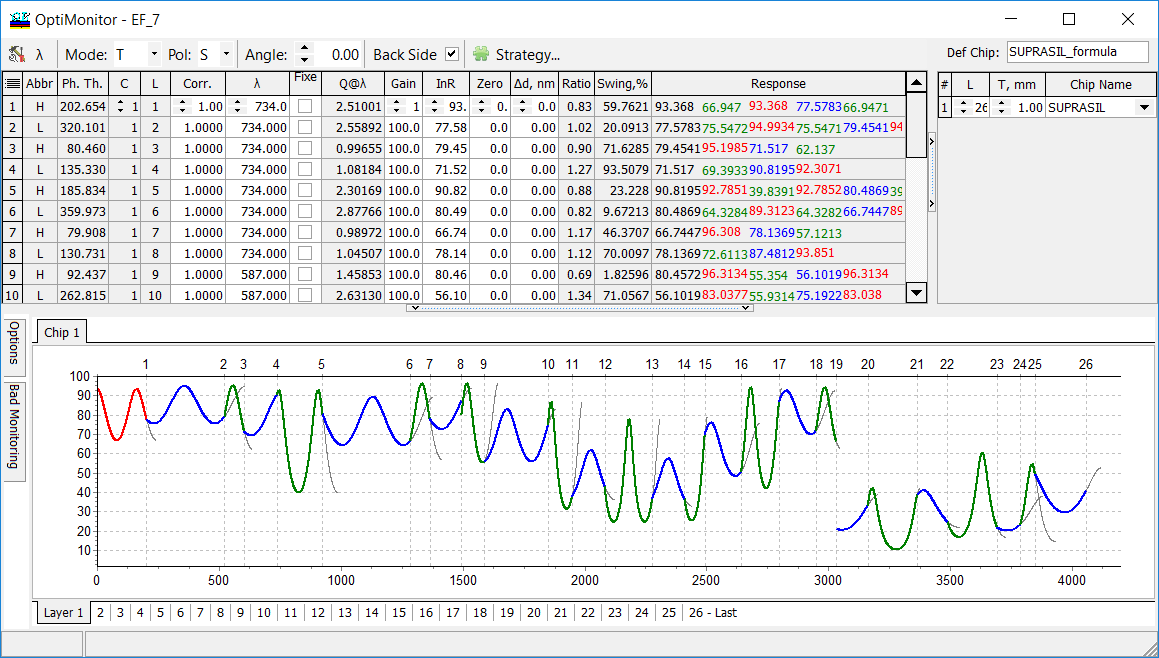
The OptiLayer Monitoring Spreadsheet consists of ten columns:

  • The first two columns show layer material abbreviations (Abbr) and layer physical thicknesses (Ph.Th.) for the design loaded in the memory;
  • The column C indicates the number of the witness chip on which the corresponding design layers will be deposited;
  • The column L displays the number of design layers to be deposited on each particular chip, starting from 1;  The correspondence between the design layers and witness chips is set in the Witness Spreadsheet located in the right upper part of the window;
  • In the column Corr you can specify correction factors representing the ratios between the physical thicknesses of layers on a witness chip and actual physical thicknesses of the material being deposited on the actual parts being coated.  The default correction factors are equal to 1;
  • The column λ is used to specify the wavelength at which the optical monitoring is being done for each specific layer. It is possible to use the Monitoring Wavelength Adjustment option invoked by clicking the button λ in the left upper corner of the window;
  • The column Q@λ is used to represent the quarter-wave optical thickness at the λ monitoring wavelength;
  • The column Gain displays scaling factors obtained after the use of the Gain and Zero option. (NEW!) The values also can be edited directly in the Monitoring Spreadsheet.
  • The column Zero represents Zero Offset values entered with the help of the Gain and Zero option. (NEW!) The values also can be edited directly in the Monitoring Spreadsheet.
  • The column Ratio displays the ratio between the values of the spectral response at the end and the beginning of each layer deposition.
  • The column Swing,% displays signal swing value determined as the ratio of the difference between the trigger-point signal value and maximum of the signal to the signal amplitude. Signal amplitude is the difference between signal maximum and minimum values. If a maximum or a minimum of the signal, or both are not available during layer deposition, OptiLayer considers sufficient virtual increase of the layer thickness until required extrema are located.
  • The column Response shows more detailed information on the spectral response during the layer deposition. The first and the last values in this column correspond to the transmittance/reflectance of the witness chip at the beginning and end of the layer deposition, respectively.  Between these values, all spectral response maxima and minima that occur during the layer deposition are shown.  Spectral response maxima are shown in red while spectral response minima are shown in green. 
 OptiLayer proposes various algorithms for specification of monitoring spreadsheets.
Creating a good set of instructions for an optical monitoring system can be a tedious task. The OptiLayer Monitor option enables you to create a monitoring spreadsheet for your design.  The OptiMonitor dialog allows you to automatically generate the sequence of monitoring wavelength (so called Monitoring Strategies ), specify witness chips in the case indirect monitoring and graphically emulates the theoretical response of the optical monitor system during the deposition process. The Monitoring strategies are:

Strategy 1 is based on the choice of the most sensitive wavelength of each layer

Strategy 2 is aimed at minimizing the cumulative effect of thickness errors

Strategy 3 aimed at minimizing the cumulative effect of thickness errors and takes into account additional requirements that are necessary in order to increase the robustness and reliability of real-time algorithms working with Optical Monitoring Systems

Strategies 4 and 5 are very advanced strategies taking into account many criteria with ability to weight different requirements and simultaneously to minimize the number of different monitoring wavelengths. See  the details in our recent publication.


 See the details in our publications:
  1. M. Trubetskov, T. Amotchkina, A. Tikhonravov, Automated construction of monochromatic monitoring strategies, Appl. Opt., Vol. 54, pp. 1900-1909 (2015)
  2. A. V. Tikhonravov and M. K. Trubetskov, “Elimination of cumulative effect of thickness errors in monochromatic monitoring of optical coating production: theory,” Appl. Opt. 46, 2084-2090 (2007).
  3. A. V. Tikhonravov, M. K. Trubetskov, and T. V. Amotchkina, “Computational experiments on optical coating production using monochromatic monitoring strategy aimed at eliminating a cumulative effect of thickness errors,” Appl. Opt. 46, 6936-6944 (2007).
  4. A. V. Tikhonravov, M. K. Trubetskov, and T. V. Amotchkina, “Statistical approach to choosing a strategy of monochromatic monitoring of optical coating production,” Appl. Opt. 45, 7863-7870 (2006)

Look our video examples

Look our video examples at YouTube

OptiLayer videos are available here:
Overview of Design/Analysis options of OptiLayer and overview of Characterization/Reverse Engineering options.

The videos were presented at the joint Agilent/OptiLayer webinar.