
| Analysis –> Errors –> Error Yield Analysis
OptiLayer allows you to estimate production yield of a multilayer design assuming a certain specified level of errors in layer optical parameters (layer thicknesses, refractive indices and extinction coefficients). Yield Analysis Setup window has three tabs: Yield Options (Fig. 1), Thickness and Refractive index. The number of tests is the total number of statistical tests. In order to estimate the production yield, a range target, defining an allowed corridor of variations from target spectral characteristics, must be specified (see examples in Figs. 2 and 3). |
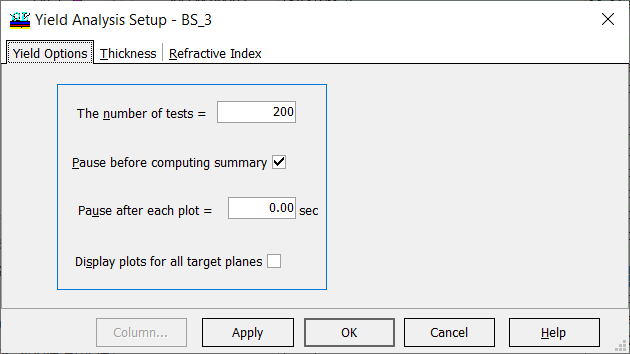
Fig. 1. Settings in Yield Analysis Setup. |
| Let a total number of statistical tests is \(N\) (in Fig. 1, \(N=200\)). If the spectral characteristic is the allowed corridor defined by the range target, then the statistical test is successful. Production yield \(Y\) can be estimated as a ratio of successful and total statistical tests:
\[ Y=M/N, \] where \(M\) is the number of successful tests. Evidently, if the number of tests \(N\) is increased, then \(Y\) gives a more accurate estimation of production yield. OptiLayer allows you to obtain multiple excellent solutions to the same design problem. These design solutions may exhibit, however, different stability to deposition errors. One of the ways to select stable designs is to perform pre-production error analysis, for example, using yield analysis. |
|
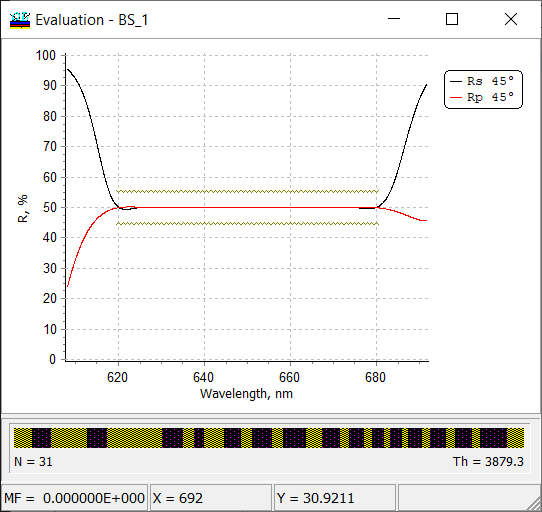
Fig. 2. Nominal reflectance of a 31-layer beamsplitter BS_1. Crosses show range target, which is \(50\%\pm 5\%\) in the spectral range from 620 to 680 nm. |
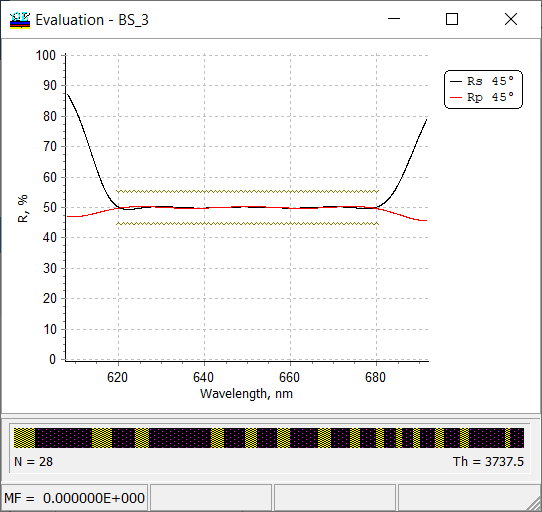
Fig. 3. Nominal reflectance of another beamsplitter solution (a 31-layer beamsplitter BS_3). Crosses show range target, which is \(50\%\pm 5\%\) in the spectral range from 620 to 680 nm. |
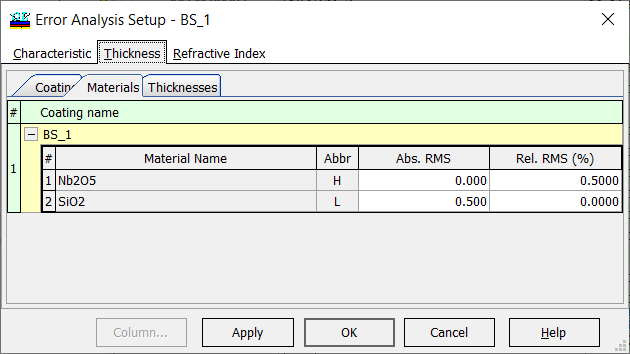
Fig. 4. Settings for error yield analysis: 0.5 nm absolute errors in thicknesses of low-index layers and 0.5% errors in thicknesses of high-index layers. |
The level of thickness errors and offsets in optical constants are specified in Thickness and Refractive Index tabs in the same way as in conventional statistical error analysis. The disturbed designs are calculated according to the same rules as in statistical error analysis.
Current and final estimations of yield are shown in the progress bar on the bottom of Error Analysis window (Figs. 5 and 6 below). Successful and unsuccessful tests are shown in green and red colors, respectively. |
Fig. 5. Error yield analysis of BS_1 solution with settings shown in Fig. 4. Final yield is about 40%. |
Fig. 6. Error yield analysis of BS_3 solution with settings shown in Fig. 4. Final yield is about 85%. |
| Reasonable values of the number of tests \(N\) and practical implementation of the option can be found in here. | |
OptiLayer provides user-friendly interface and a variety of examples allowing even a beginner to effectively start to design and characterize optical coatings. Read more…
Comprehensive manual in PDF format and e-mail support help you at each step of your work with OptiLayer.
If you are already an experienced user, OptiLayer gives your almost unlimited opportunities in solving all problems arising in design-production chain. Visit our publications page.
Look our video examples at YouTube
OptiLayer videos are available here:
Overview of Design/Analysis options of OptiLayer and overview of Characterization/Reverse Engineering options.
The videos were presented at the joint Agilent/OptiLayer webinar.