
| In OptiRE, you can calculate colors and integral values of the produced coatings based on spectral photometric data.
In OptiRE, almost all existing color coordinate systems are supported. Color evaluation window is organized in the same way as in OptiLayer. Options connected with experimental data are implemented. Color and Integral evaluations options can be found in View menu (Fig. 1). In order to calculate colors or integrals related to produced coatings, the corresponding experimental data is to be imported and loaded. Experimental data should be recorded in the appropriate spectral ranges: 380-780 nm for calculation of color properties and in the ranges where integral weight functions are specified for calculation of integral values.
|
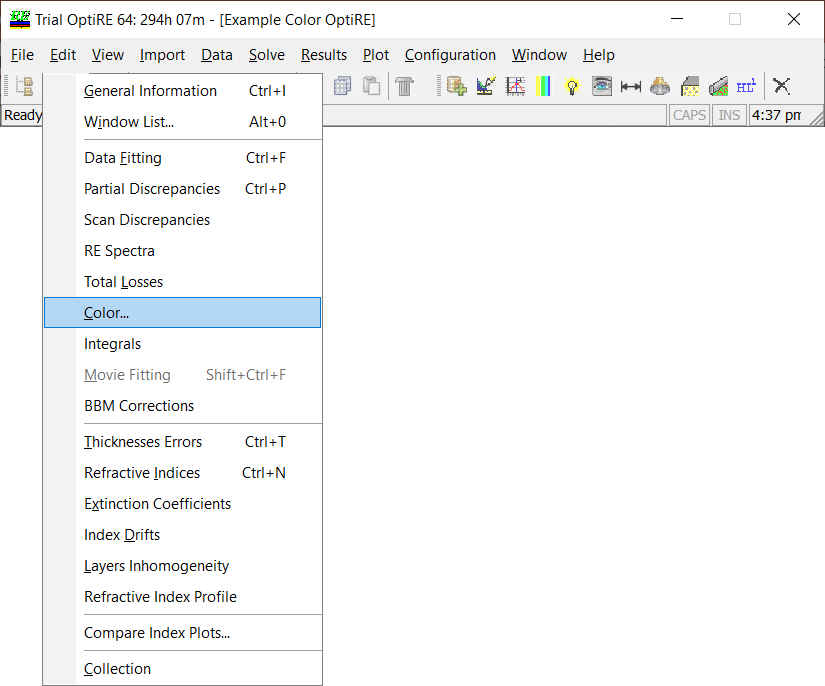
Fig. 1. View menu of OptiRE. |
| Example: we consider a produced 6-layer optical coating that reflects violet color from its front side and orange color from its back side (see the details here). In our disposal, we have reflectance, back side reflectance, and transmittance in the visible spectral range. The correspondence between model and measurement data is shown in Figs. 2 and 3. | |
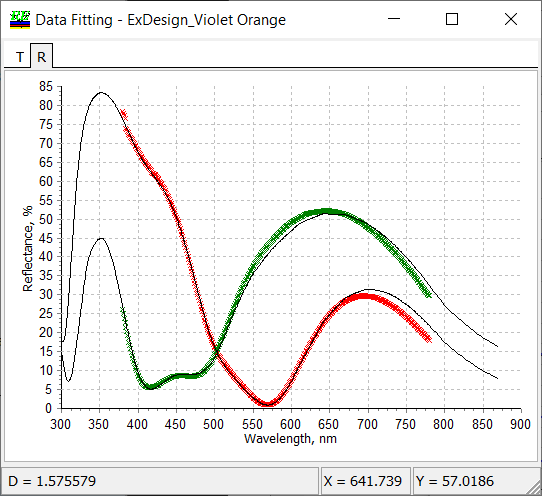
Fig. 2. Correspondence between model (black curve) and measured reflectance (red) and back side reflectance (green). |
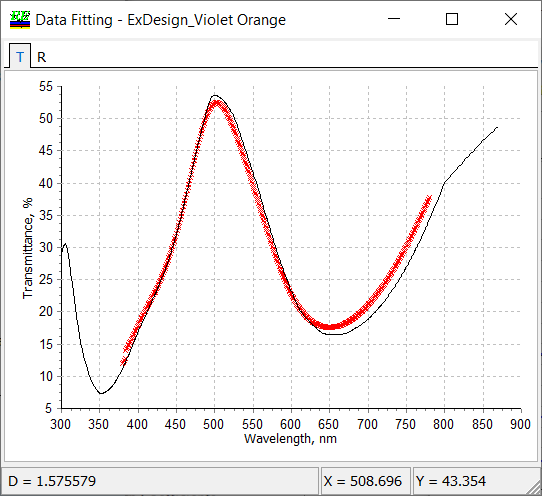
Fig. 3. Correspondence between model (black curve) and measured transmittance (red). |
| In order to compare color target values and experimental color coordinates, the corresponding targets should be loaded. These targets can be loaded through the General Information Window (Fig. 4).
This window you can use also for loading/unloading other important parameters, such as light source, detector, cone angle, line width, layer materials, substrate, design, specifications, etc. If you would like to calculate the color/integral only, you do not need to load the corresponding targets.
|
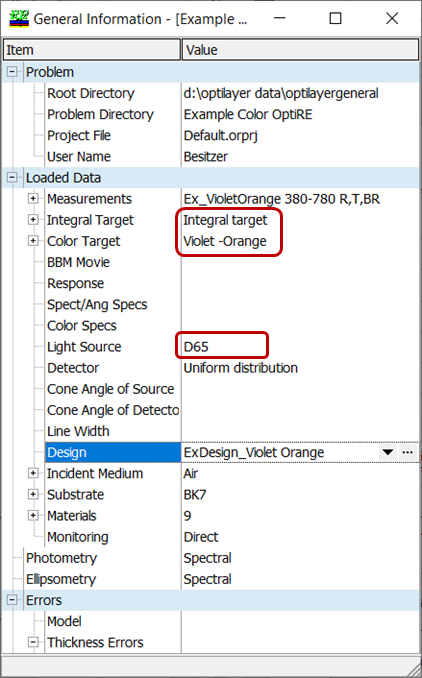
Fig. 4. Loading color target through the General Information window. |
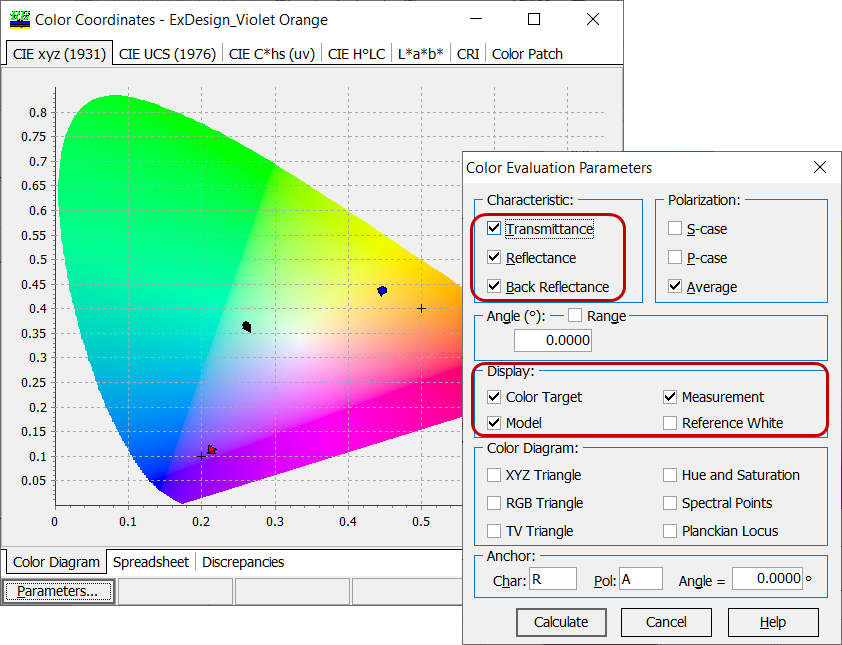
Fig. 5. Color Diagram (CIE xyz 1931) tab of the Color Evaluation window with the settings from Color Evaluation Parameters window: on the diagram, you can see color points corresponding to reflectance, back side reflectance, and transmittance. Crosses show target values. Model and measurement values are shown by markers. |
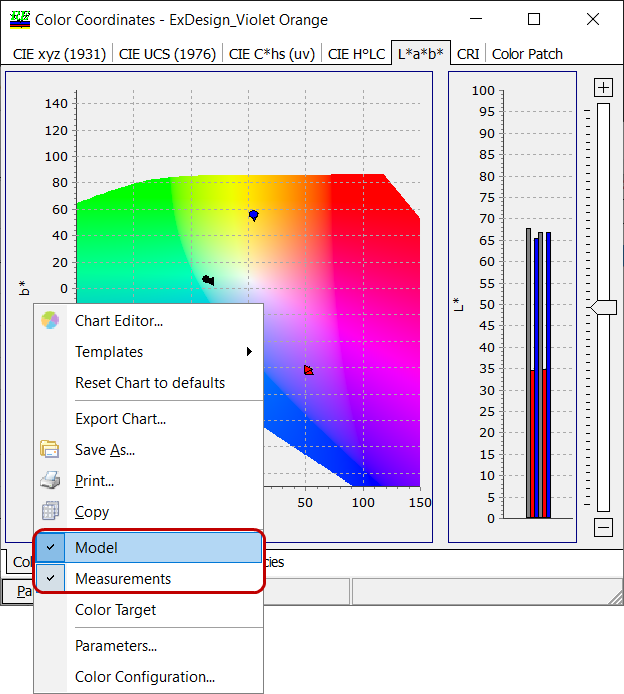
Fig. 6. Color Diagram (L*a*b*) tab of the Color Evaluation window with the settings from Color Evaluation Parameters window from Fig. 5. Using right mouse button, you can open a pop-up menu and choose model or/and measurement values by check/uncheck corresponding options. The color option is absent, since the color target is specified in terms of chromaticities color coordinates (not L*a*b*). |
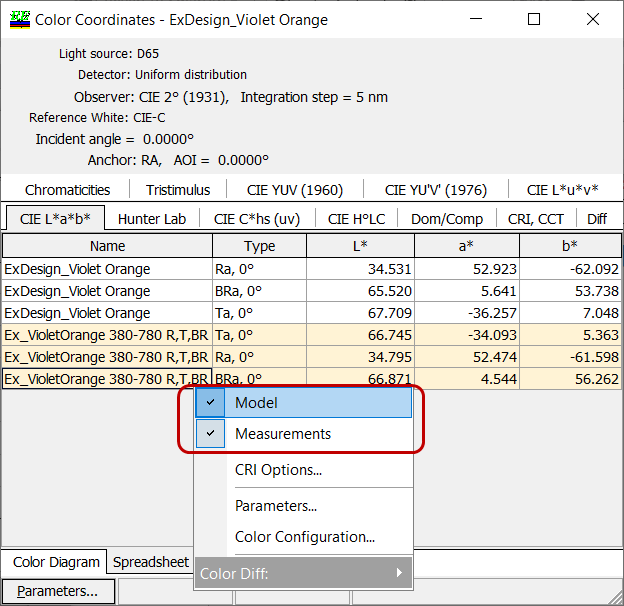
Fig. 7. Color Spreadsheet tab (CIE L*a*b*) tab of the Color Evaluation window with the color coordinates calculated for model (white cells) and measurement (yellow cells) spectral characteristics. Using right mouse button, you can open a pop-up menu and choose model or/and measurement values by check/uncheck corresponding options. |
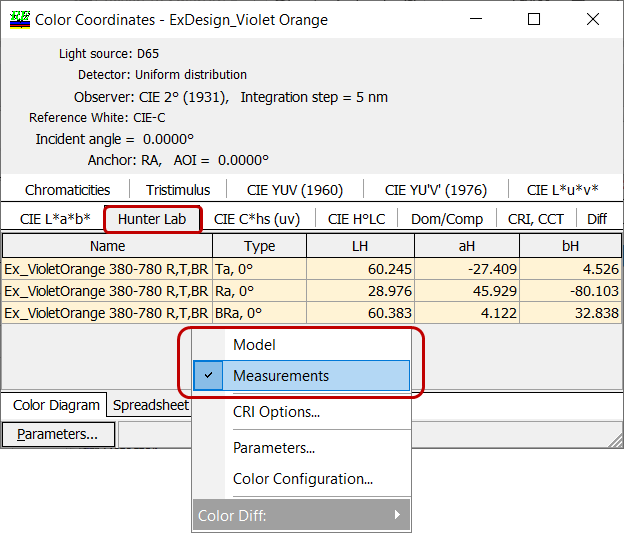
Fig. 8. Color Spreadsheet tab (Hunter Lab) tab of the Color Evaluation window with the color coordinates calculated for measurement (yellow cells) spectral characteristics. Using right mouse button, measurement values were chosen. |
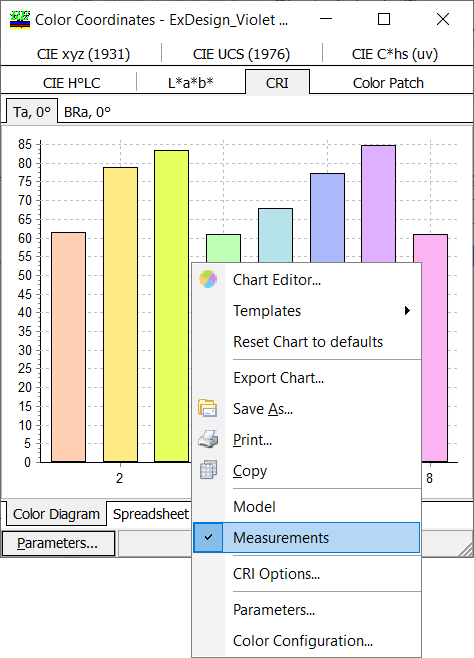
Fig. 9. Color Rendering Index (CRI) tab of the Color Evaluation window calculated for measurement spectral characteristics. In the corresponding spreadsheet, numerical values of CRI and CCT calculated for model and/or measurement data can be found. |
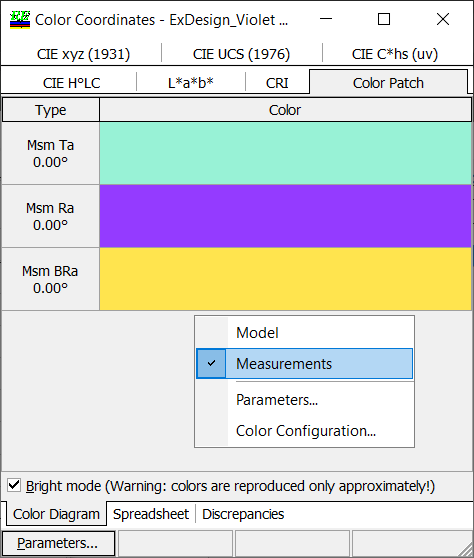
Fig. 10. Color Patch tab of the Color Evaluation window with the colors calculated based on measurement spectral characteristics. The presence/absence of model/measurement colors are controlled through the right click menu or settings in Color Parameters window (Parameters button on the bottom on the window). |
OptiLayer/OptiRE provide powerful evaluation tools for calculating color differences using six different approaches:
In the discrepancies tab of the Color Evaluation window, you can calculate color differences according to the formula specified in Diff. Formula field. In Fig. 11, CIEDE2000 system is chosen. Reference is chosen in Reference field. This parameters if important in “non-symmetrical” color coordinate systems only.
|
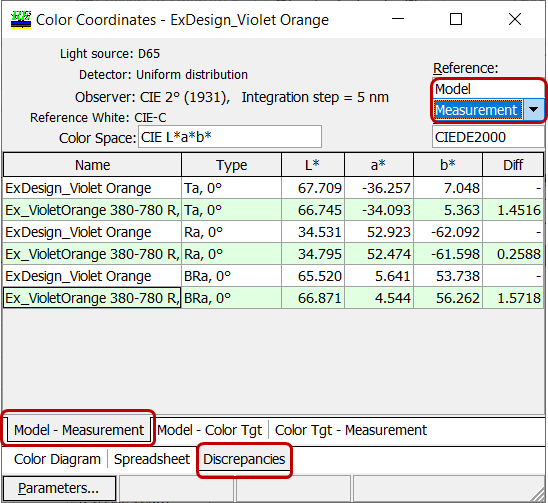
Fig. 11. In the current example, model is chose as a reference, CIEDE2000 as differential formula. Model and measurement color values are compared (tab Model-Measurement on the bottom of the window). |
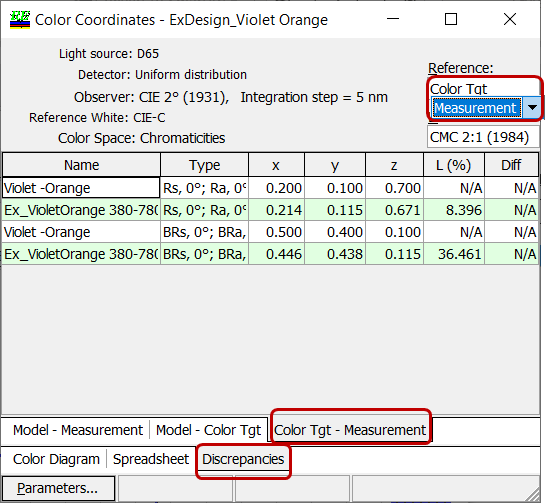
Fig. 12. In this calculation, measurements is chosen as a reference, CMC 2:1 (1984) as differential formula. Color target and measurement color values are compared (tab Color Tgt-Measurement on the bottom of the window). |
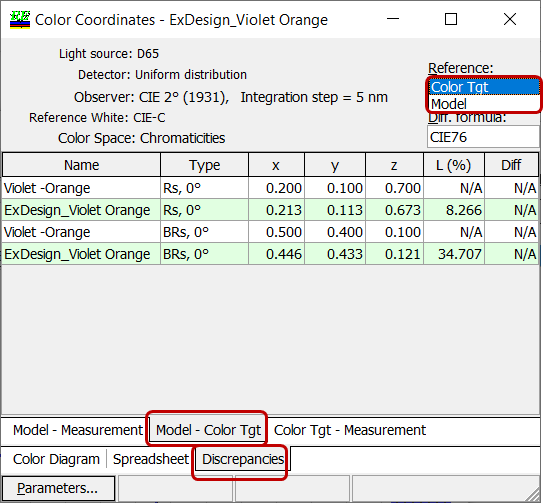
Fig. 13. In this calculation, color target is chosen as a reference, CIE76 as differential formula. Model and Color target values are compared (tab Model – Color Tgt on the bottom of the window). In some cases, color difference cannot be calculated due to specific structure of the color difference formula! In this case, N/A is shown. |
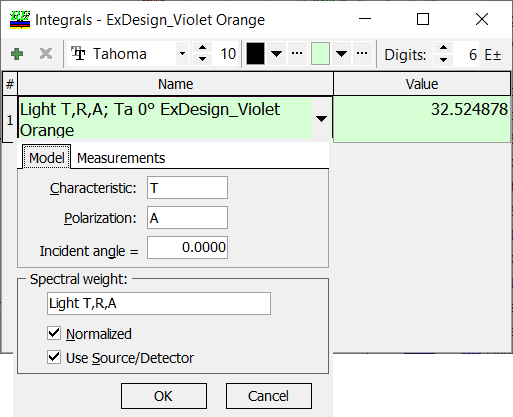
Fig. 14. Spectral transmittance integrated with relative spectral distribution of illuminant D65 is chosen. |
Integral values of model and measurement spectral characteristics can be calculated in OptiRE. Using ‘+’ button, you can add integral values for different integral weight functions, polarization, incidence angels.
The Normalized and Use Source/Detector check boxes define whether the integral characteristic normalized and whether source/detector spectral intensities are taken into account. The details are here. You can create, save and restore your own style of the window (fonts, font sizes, format of the number, colors etc.). The details are here.
|
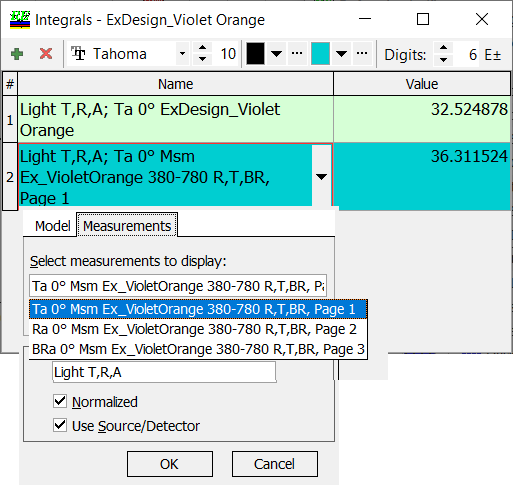
Fig. 15. Measurement transmittance integrated with relative spectral distribution of illuminant D65 is chosen. |
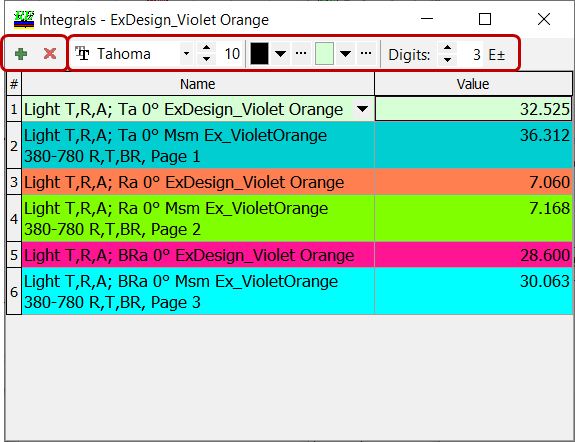
Fig. 16. Model and measurement reflectance/back side reflectance integrated with relative spectral distribution of illuminant D65 are added. It is seen that the model and experimental integral values are quite close. |
Related publications:
|
|
OptiLayer provides user-friendly interface and a variety of examples allowing even a beginner to effectively start to design and characterize optical coatings. Read more…
Comprehensive manual in PDF format and e-mail support help you at each step of your work with OptiLayer.
If you are already an experienced user, OptiLayer gives your almost unlimited opportunities in solving all problems arising in design-production chain. Visit our publications page.
Look our video examples at YouTube
OptiLayer videos are available here:
Overview of Design/Analysis options of OptiLayer and overview of Characterization/Reverse Engineering options.
The videos were presented at the joint Agilent/OptiLayer webinar.