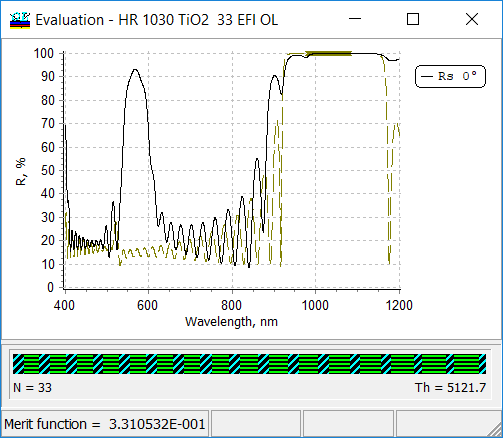
| OptiLayer provides various tools to present graphically your results. On the Evaluation window you can see any evaluated spectral characteristics.
|
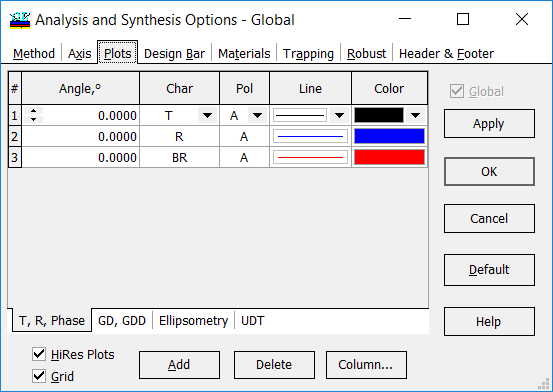
All evaluated spectral characteristics can be plotted. You can easily adjust types of plots, axis, scales, etc.
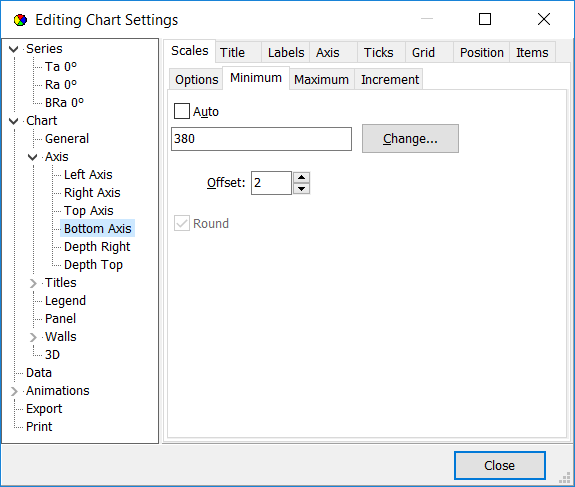
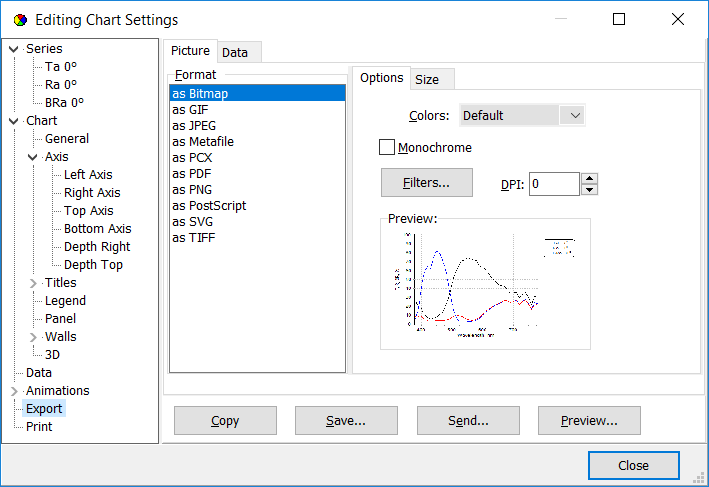
The plots can be adjusted through standard chart settings:
|
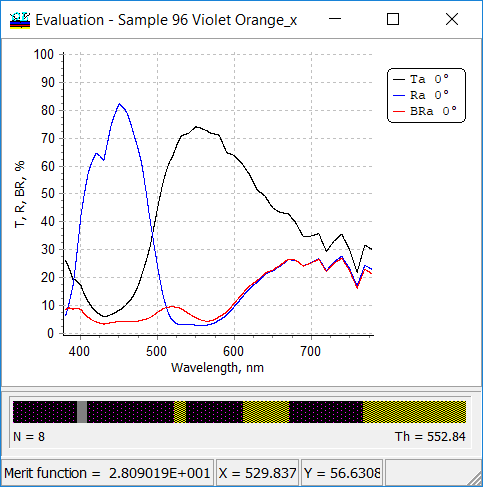
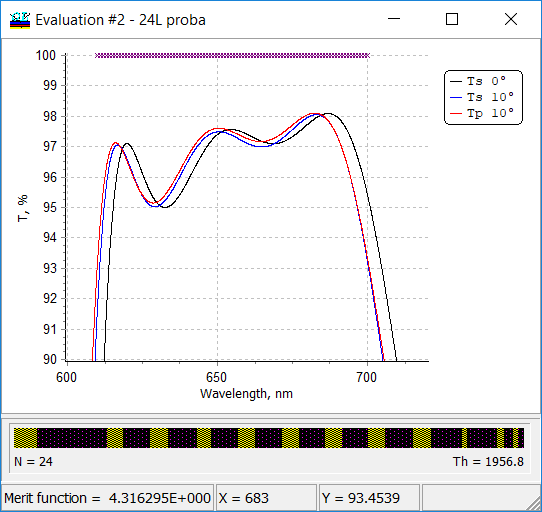
| Along with the main Evaluation window, you can open multiple evaluation windows and plot the same or other spectral characteristics related to the same design at different angles of incidence, polarization, spectral ranges.
Example: main evaluation window shows transmittance of a bandpass filter and target values (violet crosses)
|
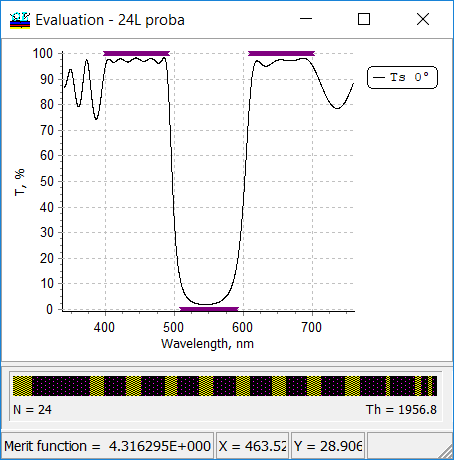
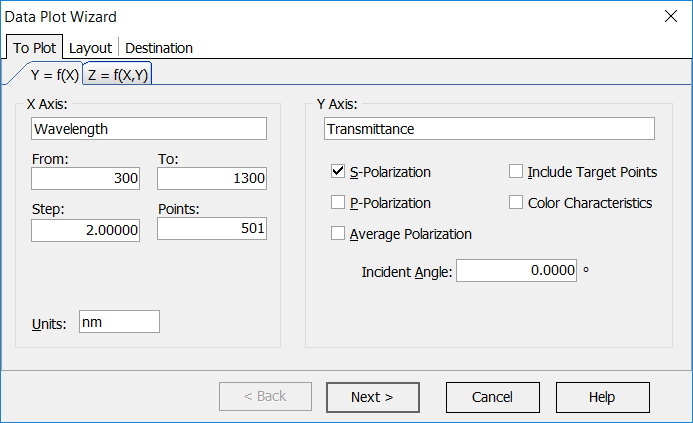
For example, you may need to plot other spectral characteristics in order to better present features in the most important spectral ranges. You may need to see what happens if the angle of incidence deviates from that one that what used in the design process.
Example: second evaluation window presents transmittance of the same bandpass filter in one of the high-transmittance ranges and in a larger scale. Spectral behavior at small incidence angles ican be also interesting:
|
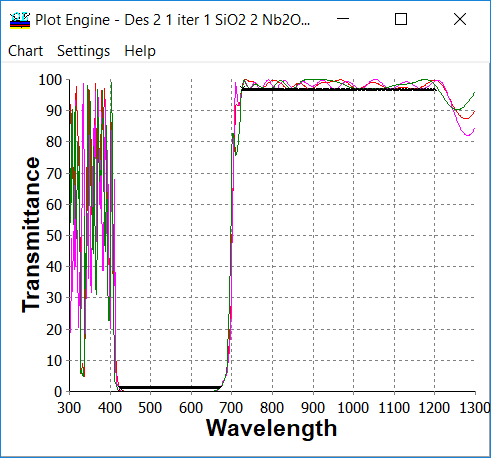
| You can compare spectral characteristics of different designs at one plot or combine multiple spectral characteristics at one plot. The option and its settings are available through: Analysis –> Plot Engine:
|
Example: comparison of transmittance data of three different designs:
|
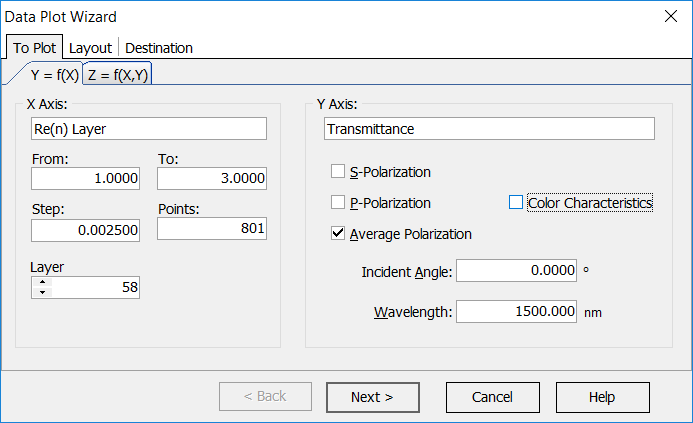
Using the powerful Analysis –> Plot Engine option you can plot dependencies of different spectral characteristics on various coordinates, namely:
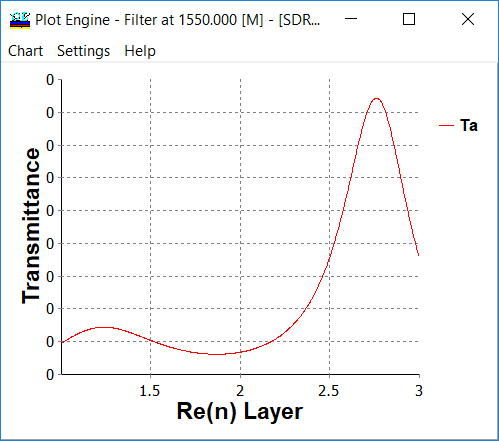
Example: Settings and dependence of the coating transmittance (averages polarization, wavelength 1500 nm) on the refractive index of the last 58-th layer.
|
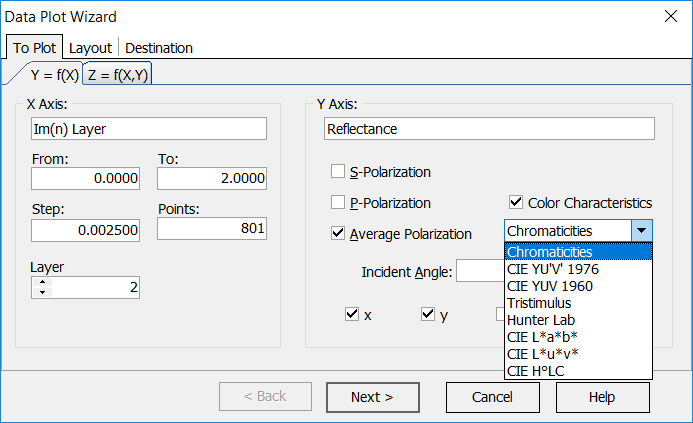
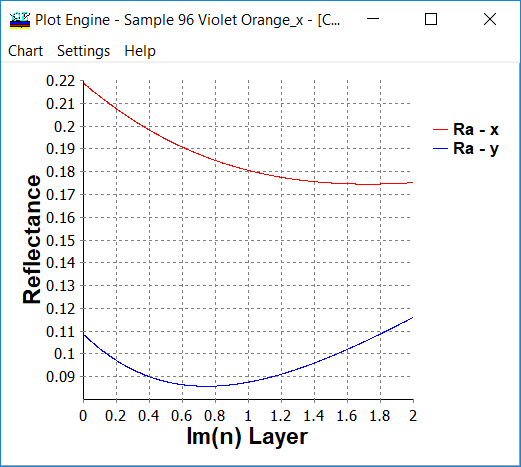
You can also plot dependencies of color coordinates in any color coordinate systems on various parameters.
This powerful option can be applied in a combination with the Variator and provide all visual analysis possibilities of optical coatings designs. You can compare dependencies related to different designs or combine dependencies calculated for different spectral or angular ranges. You can save the plots as *.vtc2 files and combine them using stand-alone Plot Engine module. You can export the numerical data of the plots using: Right mouse button –> Chart –> Export –> Data –> Selection from Excel, text, HTML, etc. formats –> Save You can modify axis, panels, etc. using standard Chart tools. Example: Settings and dependence of the color coordinates of the reflected light of a coating (averages polarization, chromaticities \(x\) and \(y\)) on the extinction coefficient of the second (metal-dielectric) layer.
|
|
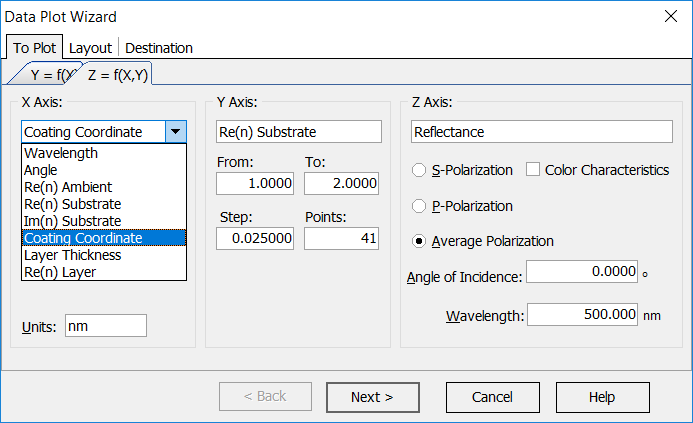
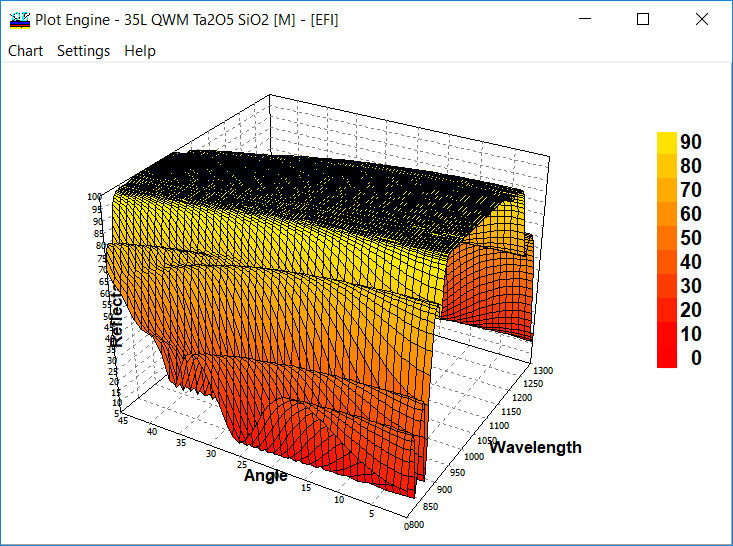
Through Analysis –> Plot Engine option you can plot characteristics as functions of one or two parameters, according to the choice Y = f(X) or Z = f (X,Y). The list of arguments includes Wavelength, the Angle of incidence, Re(n) Ambient medium, Re(n) substrate, Im(n) substrate, coating coordinate, layer thickness, and Re(n) layer. The same set of arguments is provided for Y argument if you select a Z = f (X,Y) mode. In the same frame the range for the argument (From… To), the number of points (Points) and the argument increment between the points (Step) are specified.
|
Example: 3D plot – dependence of the filter reflectance on the wavelength and on the incidence angle:
All plots are ROTATABLE! |
Chart Windows (windows having plots and diagrams) has additional export formats:
|
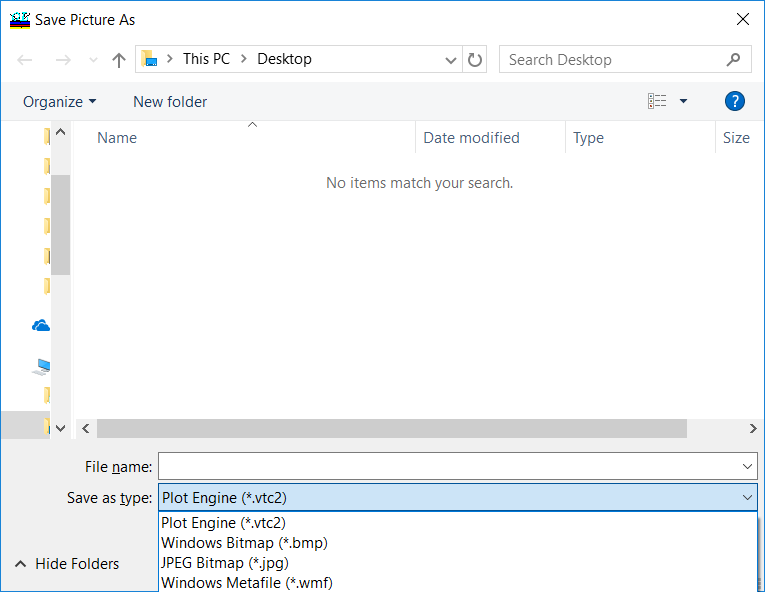
Windows can be saved as:
|
|
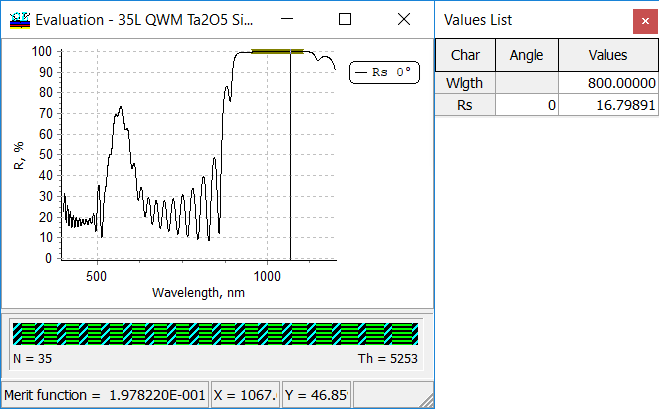
The Digitize command is accessible from popup menus of Evaluation windows invoked by the right mouse button. When any graphic plot in Evaluation, Refinement, Needle Optimization, Random Optimization and other windows is displayed, this command allows you to read exact numerical (X,Y) values of the plotted characteristics. When the Digitize command is activated, a vertical bar is displayed in the plot window to visually identify the graph point being evaluated, an additional window labeled “Values List” appears on the screen. The values list displays the exact numerical values of all spectral characteristics that are presented in the window. |
 |
| Memorize submenu allows to store any plot for further comparison with another plot or plots. The submenu is available through
Right mouse button –> Memorize plots |
 |
OptiLayer provides user-friendly interface and a variety of examples allowing even a beginner to effectively start to design and characterize optical coatings. Read more…
Comprehensive manual in PDF format and e-mail support help you at each step of your work with OptiLayer.
If you are already an experienced user, OptiLayer gives your almost unlimited opportunities in solving all problems arising in design-production chain. Visit our publications page.
Look our video examples at YouTube
OptiLayer videos are available here:
Overview of Design/Analysis options of OptiLayer and overview of Characterization/Reverse Engineering options.
The videos were presented at the joint Agilent/OptiLayer webinar.