
Evaluation of color characteristics
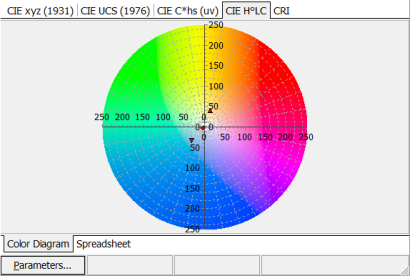
| OptiLayer provides calculations of color properties in almost all existing color coordinate systems. You can view color coordinates in a graphical or tabular forms. Light source, detector, observer, integration step, reference white and incident angle used for color evaluation are specified. OptiLayer provides a set of power options and color targets allowing you to design coatings with specified color properties. | |
Tristimulus values and chromaticities |
|
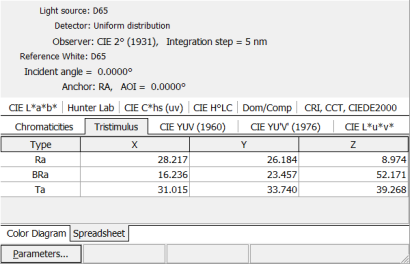
| XYZ CIE 1931 color space. Color coordinates are called tristimulus values X, Y, Z and determined as:
\(X=\int\limits_{380 nm}^{780 nm} x(\lambda) E(\lambda) d\lambda \) \(Y=\int\limits_{380 nm}^{780 nm} y(\lambda) E(\lambda) d\lambda \) \(Z=\int\limits_{380 nm}^{780 nm} z(\lambda) E(\lambda) d\lambda \) |
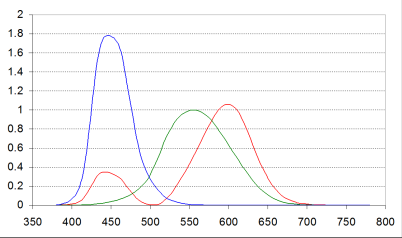
Color basis functions \(x(\lambda),\; y(\lambda),\; z(\lambda) \) |
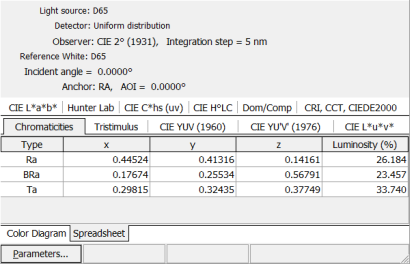
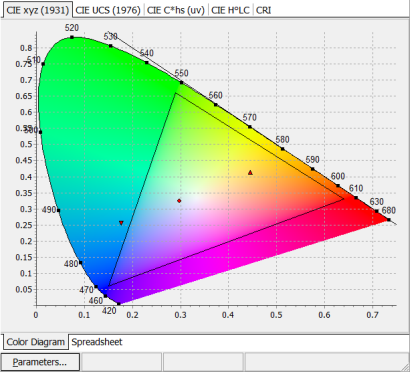
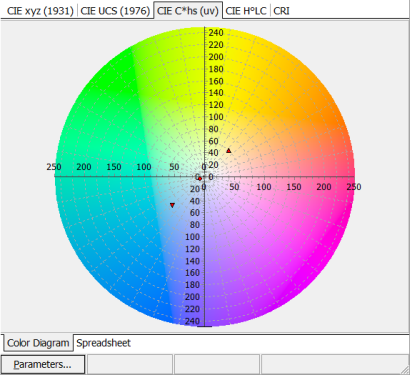
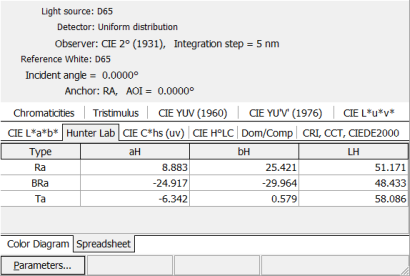
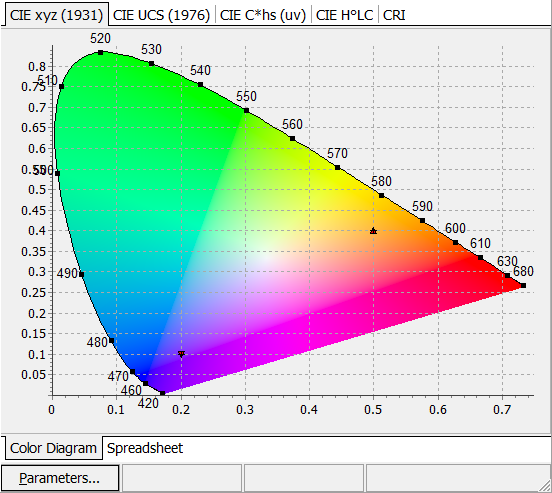
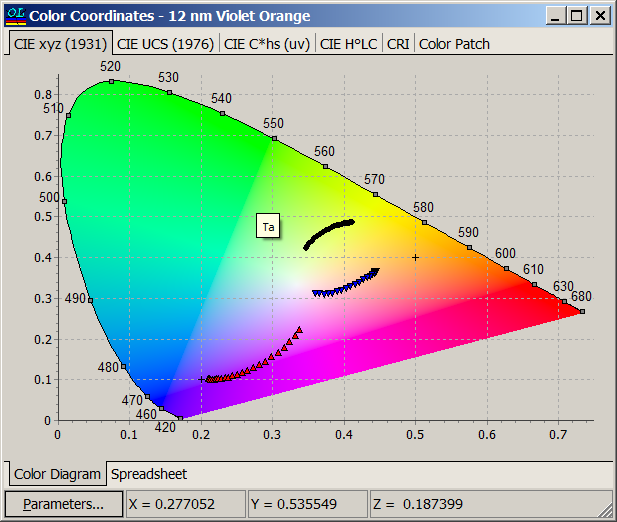
| All colors can be represented on the chromaticity diagram:
|
The chromaticity of a color can be specified by two parameters x and y, which are functions of tristimulus values X, Y, Z:
\(x=\displaystyle \frac{X}{X+Y+Z},\;\;y=\frac{Y}{X+Y+Z},\;\;z=1-x-y \) Y is the luminance factor. The larger is Y, the brighter is the color.
|
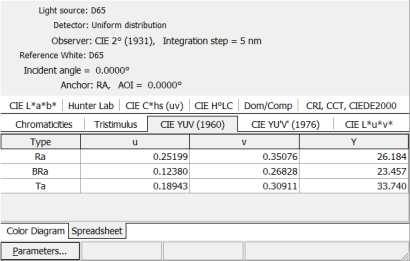
| Corresponding numerical values of color coordinates can be observed in spreadsheets: | |
 |
 |
Uniform color space (UCS)
 |
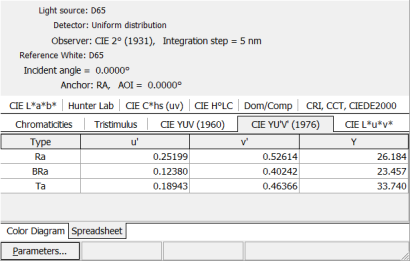
CIE UCS (Uniform Color Scale) – 1976.
Goal: the distance between different colors in the color system should correspond to the difference of colors as perceptible by a human eye: \( u’=\displaystyle\frac{4x}{-2x+12y+3} \) \( v’=\displaystyle\frac{9y}{-2x+12y+3} \) Y is luminance factor |
 |
 |
LUV color space
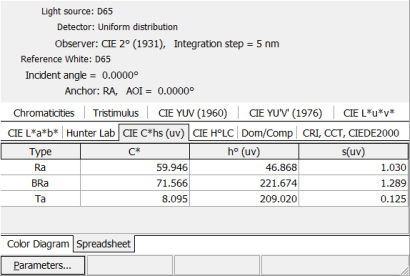
| CIELUV 1976 (L*, u*, v*) is a color space adopted by the International Commission on Illumination (CIE) in 1976, as a simple-to-compute transformation of the 1931 CIE XYZ color space, but which attempted perceptual uniformity:
\( u^*=12L^*(u’-u_n) \) \( v^*=13L^*(v’-v_n) \) \( L^*=116(Y/Y_n)^{1/3}-16 \) The cylindrical version of CIELUV is known as CIE LChuv, where C*uv is the chroma and huv is the hue: \(h_{uv}=\displaystyle\arctan\frac{v^*}{u^*}\) \(C^*_{uv}=\sqrt{*u^*)^2+(v^*)^2}\) \(s_{uv}=\displaystyle\frac{C^*_{uv}}{L^*}\) |
 |
 |
 |
LAB color space
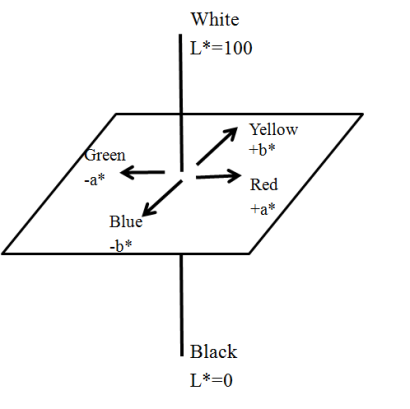 |
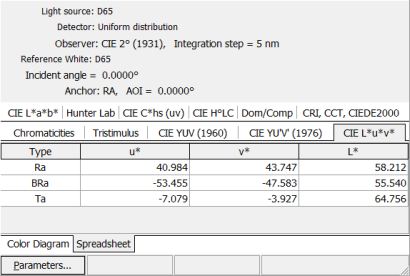
La*b* system was recommended in 1976. This is a standard, approximately uniform color space. The CIELAB is organized in a cube form.
\( L^*=116 (Y/Y_n)^{1/3}-16 \) \( a^*=500\left[(X/X_n)^{1/3}-(Y/Y_n)^{1/3}\right]\) \( b^*=500\left[(Y/Y_n)^{1/3}-(Z/Z_n)^{1/3}\right]\) CIE H°LC diagram displays positions of hue and chroma correlates in a polar coordinate system: \(h_{ab}=\displaystyle\arctan\frac{b^*}{a^*} \) \( C_{ab}=\sqrt{(a^*)^2+(b^*)^2} \) |
 |
 |
Color Rendering Index (CRI)
| Color Rendering Index (CRI) is a quantitative measure of the ability of a light source to reproduce the colors of various objects faithfully in comparison with an reference light source. CRI can be rated on a scale from 0 to 100. CRI of 100 would represent that all color samples illuminated by a light source in question would appear to have the same color as those samples illuminated by a reference source. | |
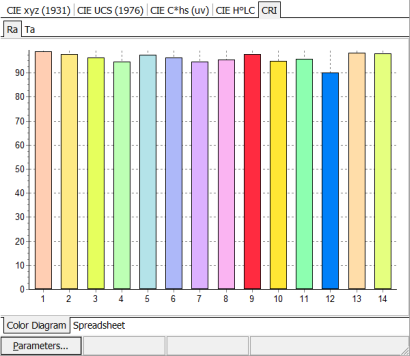 |
OptiLayer allows one to specify up to 14 reference samples.
|
| OptiLayer enables you to specify required light source, detector, observer, integration step, black body temperature, reference white points corresponding to different light sources and much more. You can find required light source and detector in corresponding OptiLayer Catalog.
OptiLayer allows you to specify white points corresponding to various light sources, namely: CIE-A, CIE-B, CIE-C, D55, D65, D75, ISO 9845-1, Black body, Uniform distribution. It is possible also to specify custom reference white. The data of the light sources, detectors, white points, observer, integration step are automatically taken into account in the color analysis and design processes. |
|
| Spectral characteristics (left panel) and color diagrams (right panel) corresponding to the same design and different light sources. (In order to observe the difference, put the mouse on the pictures) | |
 |
 |
Change of Colors due to Inhomogeneity/Interlayers/Interface roughness
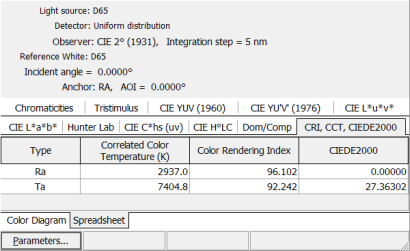
This option is activated by corresponding selection of the setup dialogs. Changes of colors are illustrated graphically at Color diagrams and numerically in all available color spaces. Additionally, the change of Dominant/Complimentary wavelength, Correlated Color Temperature (CCT), Color Rendering Index (CRI) are represented. Also, the change of colors is presented in terms of CIE DE2000 color change measure. |
|
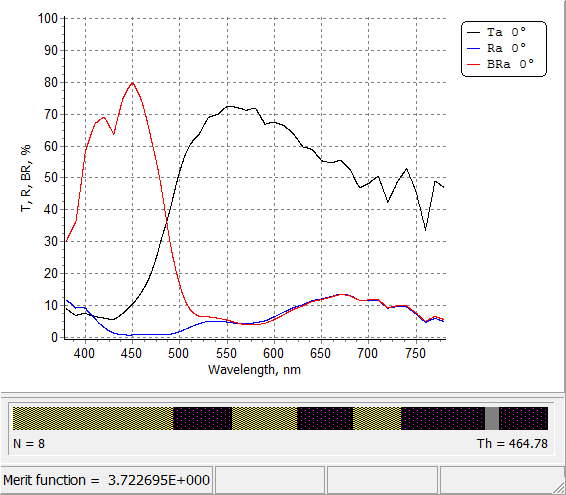
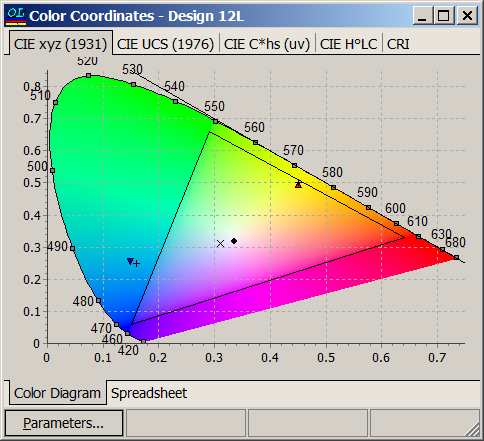
| Example: a 12-layer coating reflecting light of the yellow color from the front side (R) and the light of the blue color from the back side (BR). Left pane: color diagram representing colors of reflected and transmitted light.
|
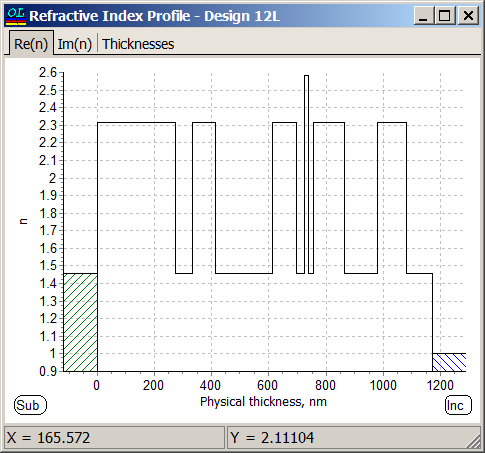
Right pane: refractive index profile. Layer materials: TiO2 (high index material), SiO2 (low index material) and NiCr (metal). At least one metal layer is necessary to achieve different colors of R and BR.
|
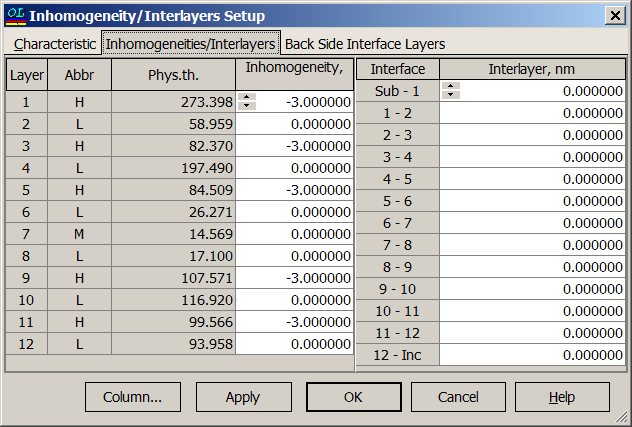
In Inhomogeneity/Interlayers Setup you should check Include Color Analysis box. There are three different possibilities to specify refractive indices of mixtures. 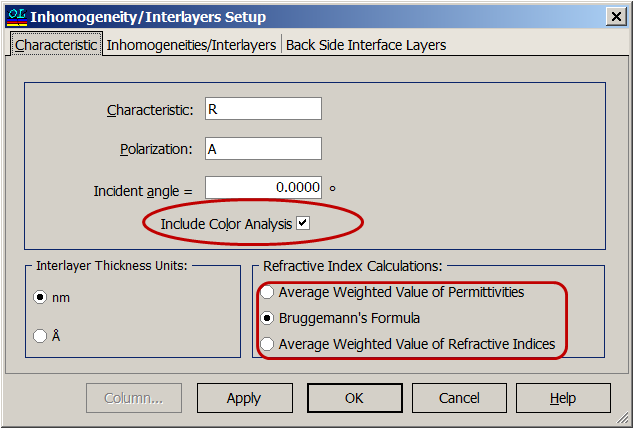 |
All H-index layers have -3% bulk inhomogeneity:
|
Disturbed refractive index profile of the 12-layer design: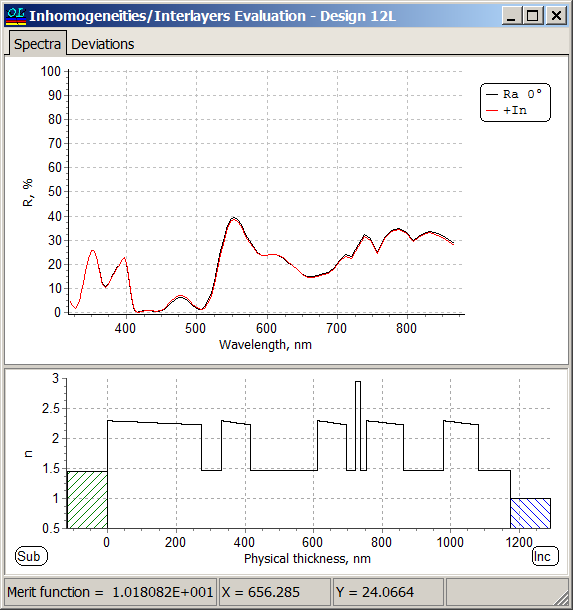 |
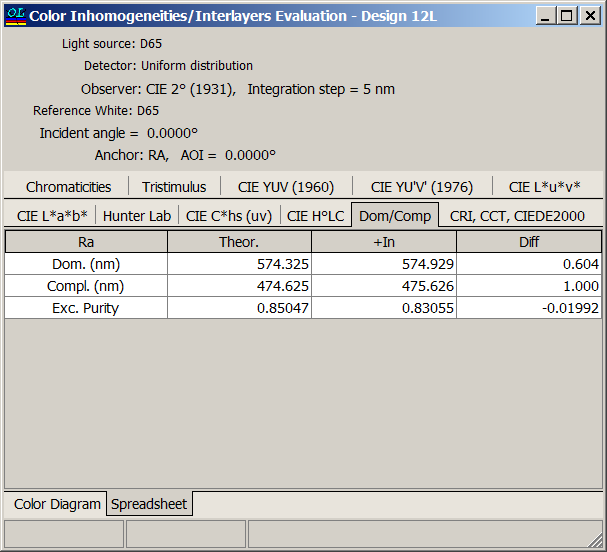
Deviations of the colors of the reflected light: 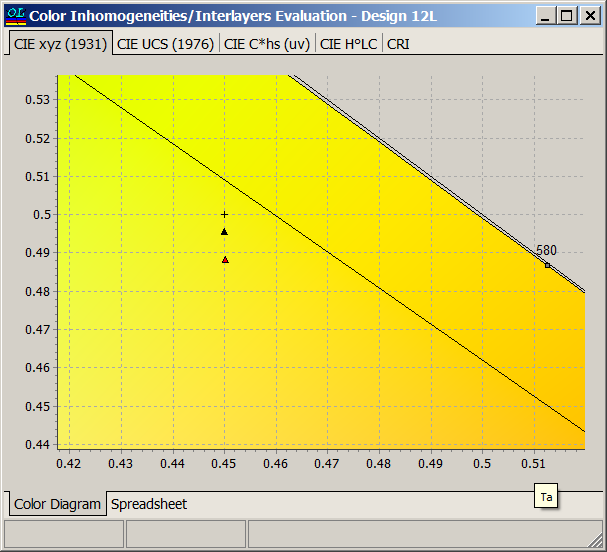
|
Deviations of the CRI, CCT and CIEDE2000 can be found in the corresponding spreadsheets: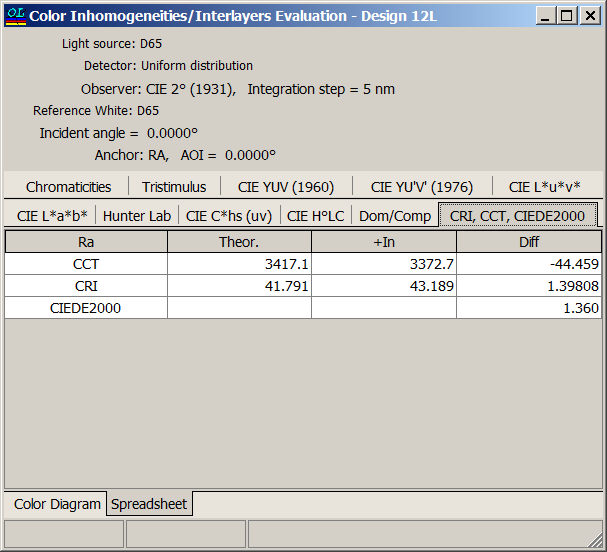 |
Changes of the Dominant/Complimentary wavelength:
|
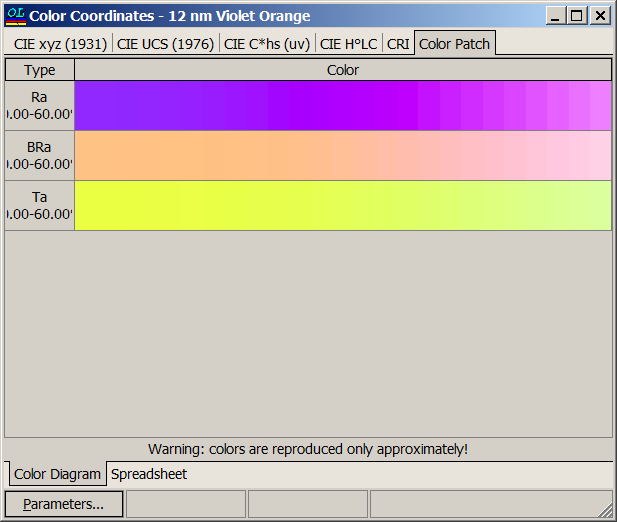
Color Patch |
|
| Color Patch window added to Color Evaluation. It allows to obtain better understanding on current color properties of the design. In order to see how colors change with respect to the incidence angle, you should specify the angular range in Parameters window. | |
 |
 |
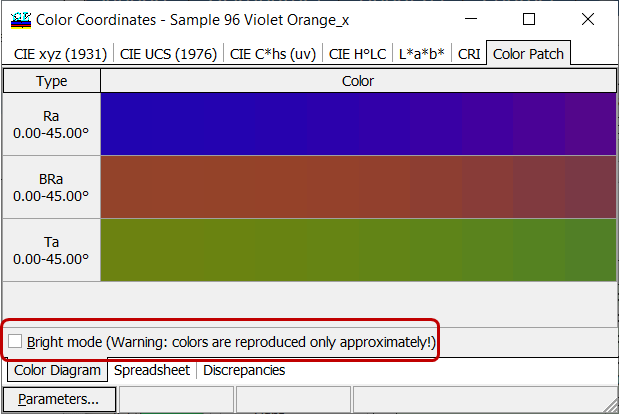
| In the new version 12.83, in color patch more natural colors is implemented.
It is possible to switch previous colors using Bright mode check box on the bottom of the Color Patch tab. Bright mode setting control if Gamma correction is applied to display or not. |
 |