| OptiLayer allows you to present the results in the form of various reports and plots. These reports and plots can be later incorporated into your documents, manuscripts etc., or shared with your colleagues. | |
|
Any evaluation window can be saved in multiple formats: *.vtc2, *.bmp, *.jpg, *.wmf, *.pcx, *.gif, *.png, and *.tiff.
|
The results in a text form can be found in corresponding Output Windows in Hierarchical View, Plain View, or Editable View forms. Results can be saved to a file, printed, and directly exported to MS Excel.
|
|
OptiLayer provides evaluation of all possible spectral characteristics in specified wavelength and angular range:
|
In order to generate the corresponding report, you need to specify a spectral range of interest and number of wavelengths points (or a wavelength step):
|
 |
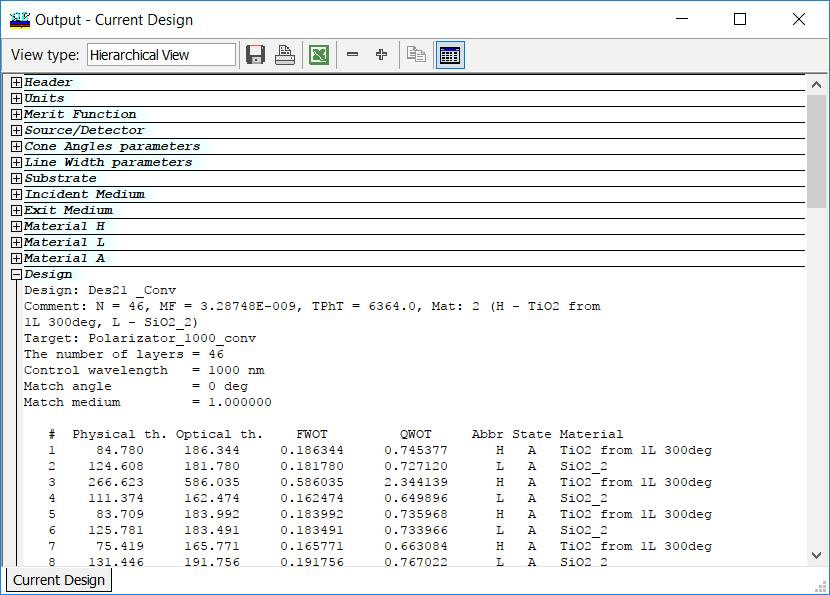
OptiLayer allows you to save all design information in the corresponding text file. The Current Design Report contains layer thicknesses, optical constants of thin-film materials, substrates, incidence medium, light source, merit function etc. The data can be fully or partially imported to Excel. |
|
In OptiLayer, you can select all or several designs in History window or in Collection window dispalying the best designs obtained in the course of Random Optimization algorithm.
|
The corresponding reports (History and Collection reports) contain structures of all selected designs and all necessary information (thin-film materials, merit function, etc.)
|
|
If you generated a monitoring spreadsheet, you can create the corresponding report containing all data from the spreadsheet.
|
The report can be saved, printed and exported to Excel.
|
|
You can create an Error Analysis Report. This option is available when the Error Analysis has been performed.
|
The corresponding report contains averaged spectral characteristics, RMS and deviations
|
|
You can create an Error Yield Analysis Report. This option is available when the Error Analysis has been performed (for demonstration please click on the picture).
|
The Error Yield Analysis report the number of misses (lower, upper and total) for each wavelength:
The Worst Case Report is composed in a similar way. |
|
OptiLayer can display the Systematic Deviations Analysis Report. This option is available when the Systematic Deviations Analysis has been performed.
|
The report shows theoretical values and their deviations caused by systematic deviations in layer parameters.
|
|
OptiLayer present a Layer Sensitivity Report if Layer Sensitivity option was applied.
|
In the Report layer thicknesses, material abbreviations, sensitivity orders, relative sensitivity, and absolute sensitivity are shown.
|
|
OptiLayer composes Inhomogeneities/Interlayers Report and Interface Roughness Report if these options were applied.
|
In the Reports you can find spectral characteristics calculated if specified inhomogeneities, interlayers or surface roughness are taken into account.
|
|
OptiLayer creates a Material Dispersion Report if Material Dispersion was plotted:
|
In the Material Dispersion Report you can find material dispersion in the spectral range of interest:
|
|
OptiLayer creates an Electric Filed Report in the case if the Field was calculated:
|
In the Report, the dependence of the electric field on the coating thickness coordinate is shown:
|
Look our video examples at YouTube
OptiLayer videos are available here:
Overview of Design/Analysis options of OptiLayer and overview of Characterization/Reverse Engineering options.
The videos were presented at the joint Agilent/OptiLayer webinar.